IEP Goal Progress Graphs FREE
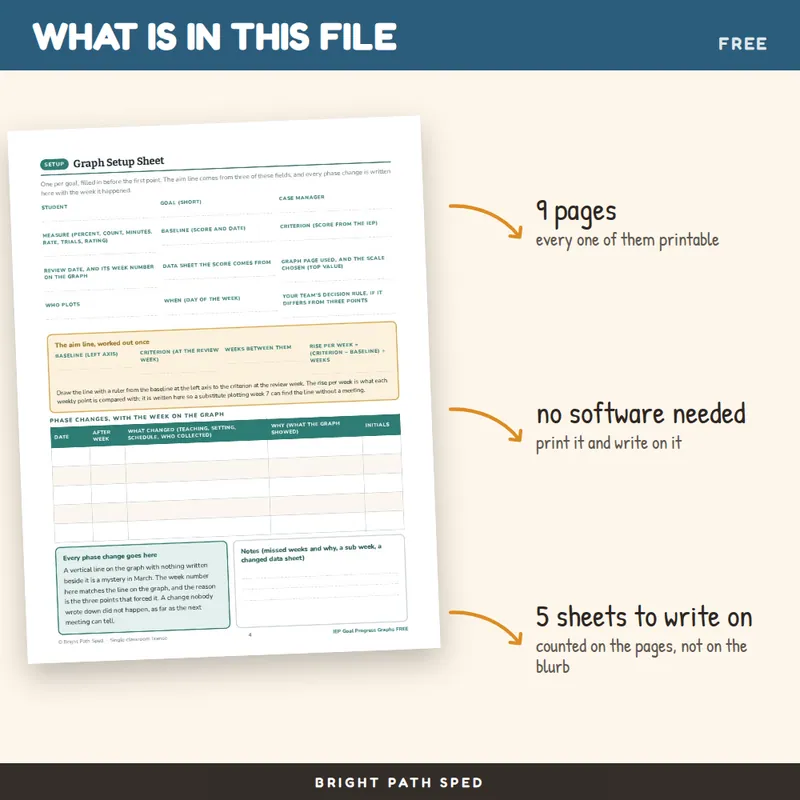
- 9 pages
- Not Grade Specific
Also on Teachers Pay Teachers: see the Bright Path Sped store
About this resource
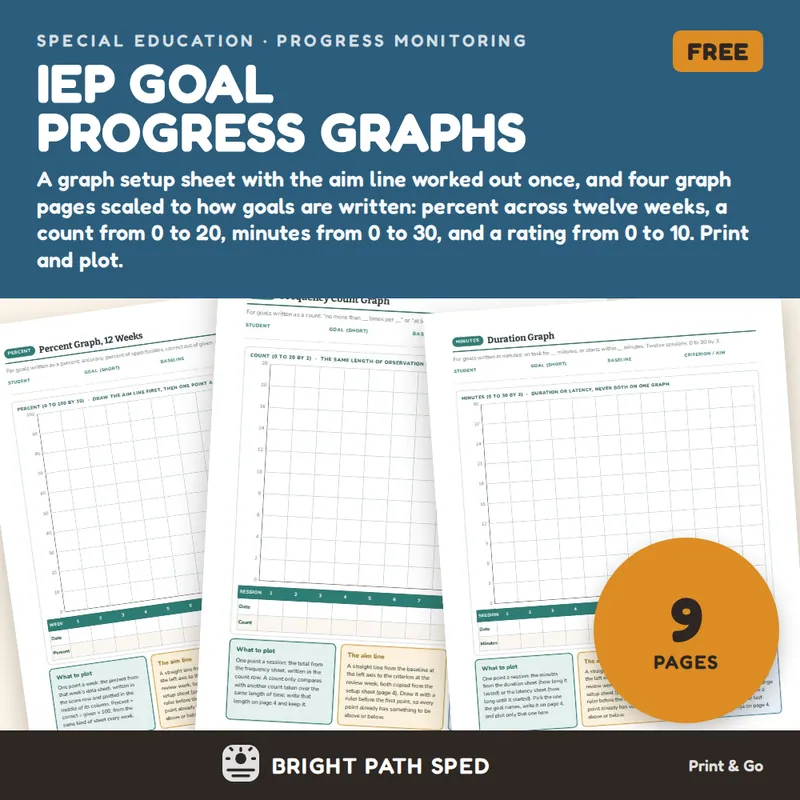
A setup sheet and four graph pages scaled to how IEP goals are written, free, print and plot: percent across twelve weeks, a frequency count from 0 to 20, a duration graph in minutes, and a rating scale from 0 to 10. The setup sheet holds the baseline, the criterion and the aim line worked out once, and the aim line and the three-point rule are printed under every grid, so the same number lands in the same place every week and the line means something when the team looks at it.
WHAT IS INCLUDED - 9 pages, 5 sheets
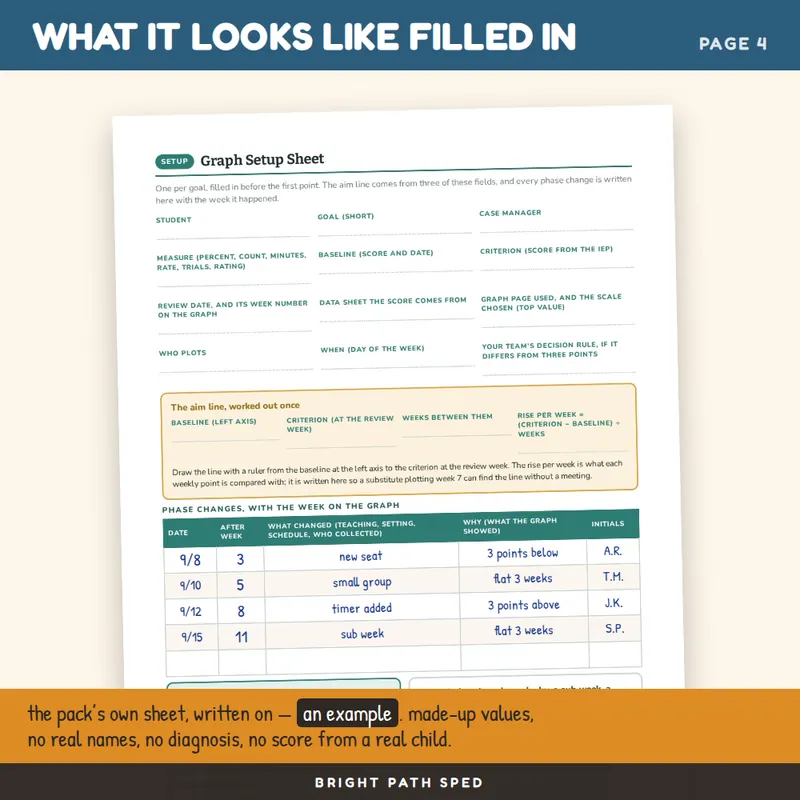
- Graph Setup Sheet - 12 lines (student, goal, case manager, measure, baseline, criterion, review date and its week number, the data sheet the score comes from, the graph page and scale, who plots, when, your team's decision rule), the aim line worked out once in four blanks (baseline, criterion, weeks between them, rise per week), a five-row phase change log with the week number on the graph, and a notes box
- Percent Graph, 12 Weeks - 0 to 100 by 10, one point a week, with date and percent rows under the grid; for goals written as accuracy, percent of opportunities, or correct out of given
- Frequency Count Graph - 12 sessions, 0 to 20 by 2, with date and count rows; for goals written as "no more than __ times per __" or "at least __ times"
- Duration Graph - 12 sessions, 0 to 30 minutes by 3, with date and minutes rows; for goals written as "for __ minutes" or "within __ minutes", duration or latency but never both on one graph
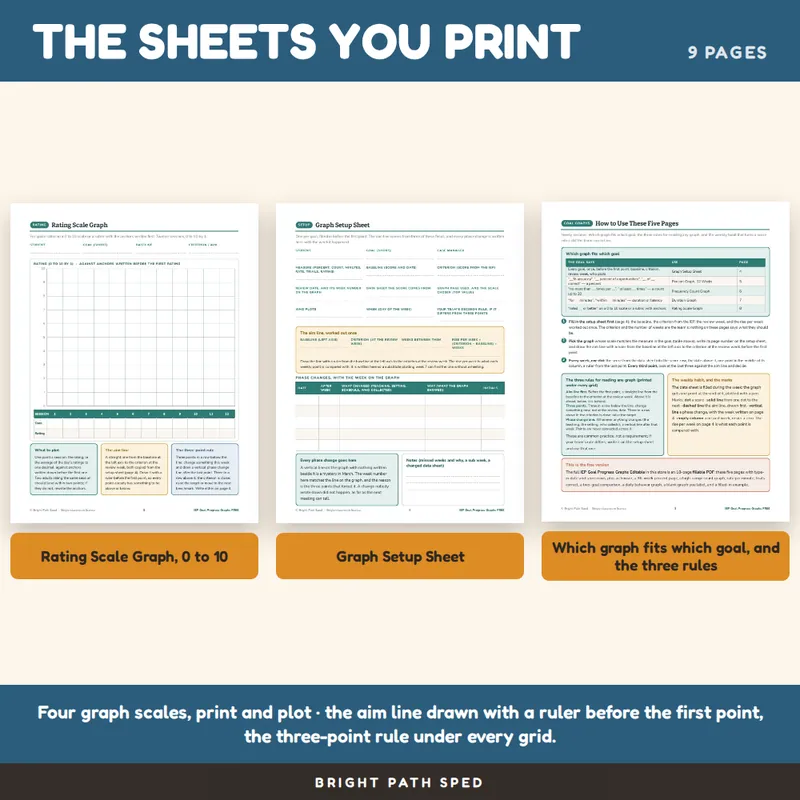
- Rating Scale Graph - 12 sessions, 0 to 10 by 1, with date and rating rows; for goals rated against anchors written before the first rating
- Every graph page carries three short cards: what to plot, the aim line, and the three-point rule
- How to Use These Five Pages - a table matching the goal's wording to the graph page, three numbered steps, the three rules for reading any graph (aim line first, three points, phase change line), and the weekly habit with the marks
The Full Pack
What This Is Not
Not a spreadsheet and not a charting tool: the file does not draw the line. You write the dates and scores under the grid and plot the points with a pen and a ruler. It does not say what a criterion should be, how many weeks a goal gets, or what a score means; those come from the student's IEP and your team, and the setup sheet has a blank for each, including a line for your own decision rule if it differs from three points. It is a print PDF, not a Google Sheets file.
Who This Is For
Special education teachers and case managers who graph IEP goals for progress reports and annual reviews, paraprofessionals who plot the weekly point, related-service providers who want the same graph in every folder, and general education teachers asked to track one goal.