Reading Stem-and-Leaf Plots Progress Monitoring Probes
- 18 pages
- 6th, 7th, 8th
$3.50
DownloadOr get it with All-Access: pick any 20 resources a month for $7.
New here? Your first month of All-Access is half off with code TEACHERTOK
Already bought this, or a member?
Instant download. One teacher's license: colleagues need their own copy. Each file carries a license number.
Also on Teachers Pay Teachers: see the Bright Path Sped store
About this resource
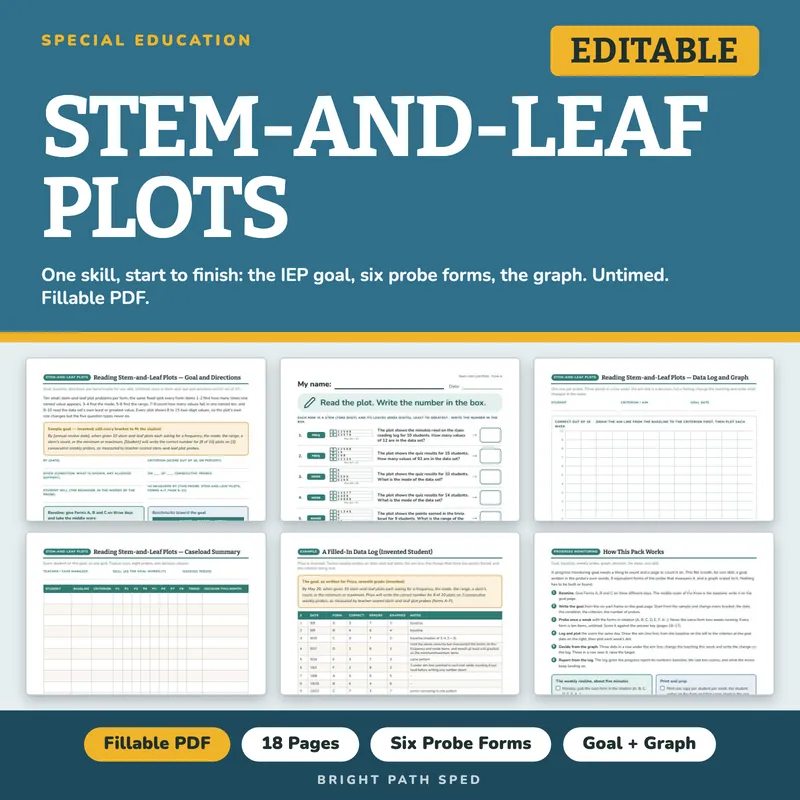
One skill, start to finish. A data-display IEP goal, six equivalent probe forms that measure it, and a graph scaled to the probe. Baseline on Monday, goal written by Tuesday, first data point on Friday.
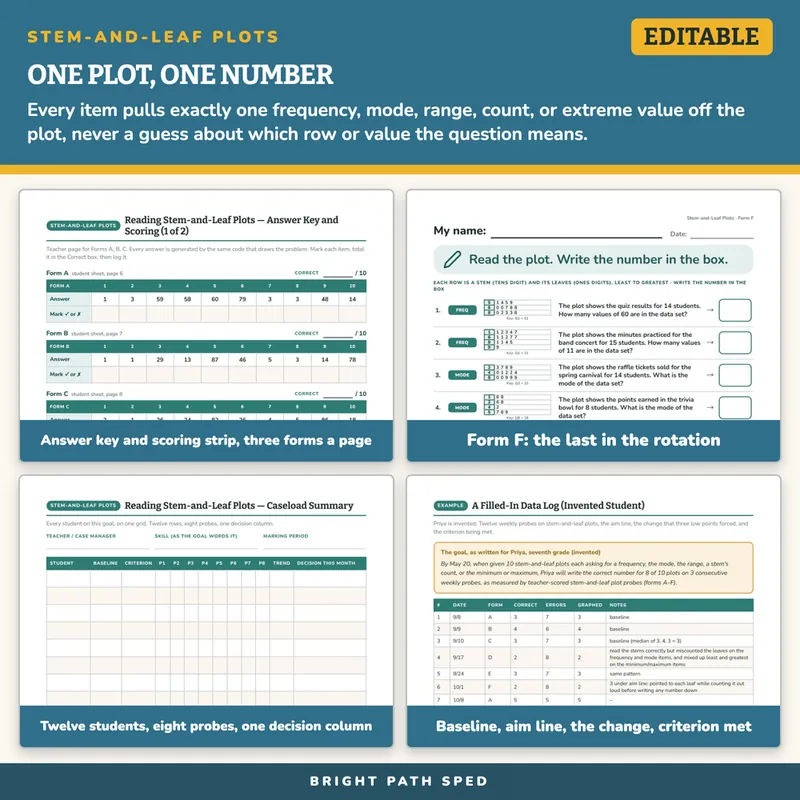
Competitor stem-and-leaf resources are worksheets that teach the format, not a scored, equivalent-forms probe built for weekly progress monitoring. Each item asks for exactly one number off a small plot — a frequency, the mode, the range, one stem's own count, or the data set's least or greatest value — so a missed item points at the plot and the number, not just a lower score. Every mode question is built so exactly one value leads, so the mode is never a tie, and every named value or stem is one the plot actually carries, so no answer is a surprise zero.
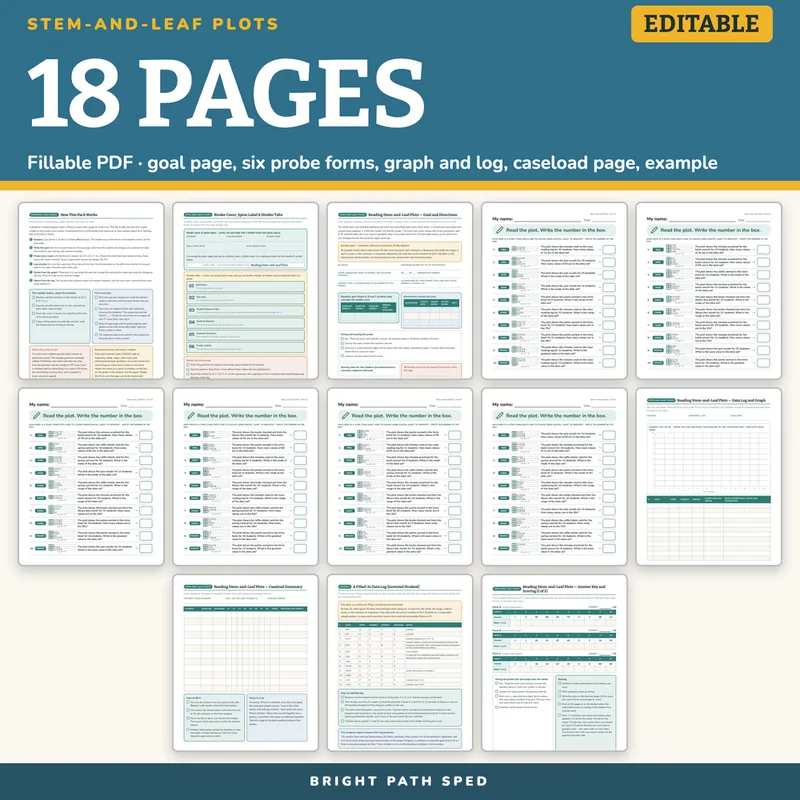
WHAT IS INCLUDED - 18 pages, six probe forms, 365 type-in fields, a binder cover and divider tabs, a family update page, a two-page teacher answer key
A Binder Cover And Divider Tabs
- A binder cover with student, case manager and school year fields, cut and slide into a binder front or folder tab
- Six divider tabs, one per section of this file, print and cut
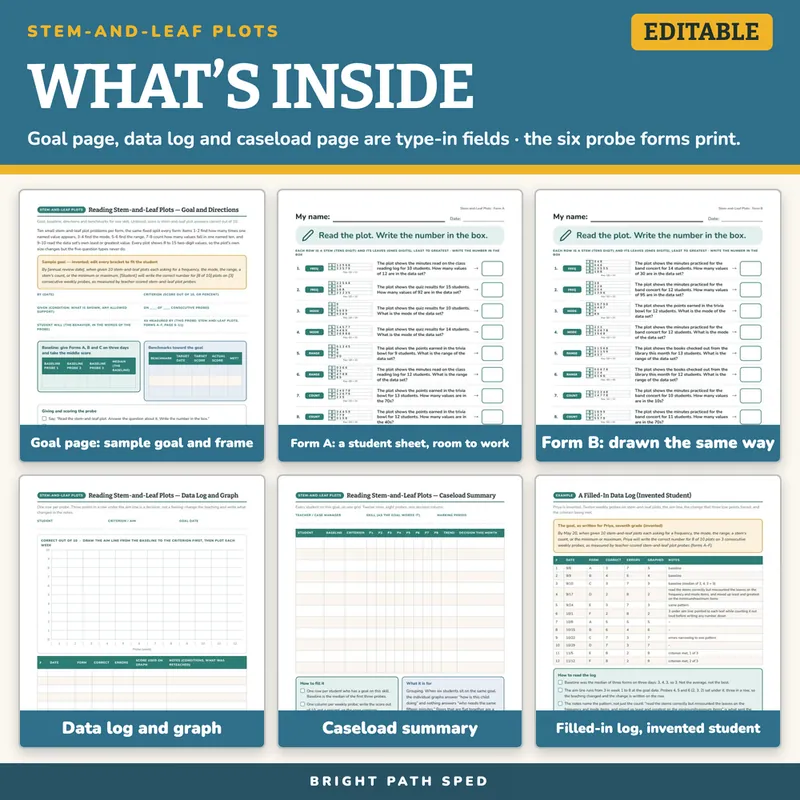
The Goal Page
- What the probe measures, in one paragraph
- A sample goal, invented, with every bracket meant to be edited by the team
- The six-part goal frame as type-in fields: by (date), given, student will, criterion, on ___ of ___ consecutive probes, as measured by
- A baseline table: three probes and the median
- Three benchmark rows with target date, target score, actual score and met
- The administration and scoring directions
- Lines for this student's own scoring rules, and a box for what the errors say to reteach
Six Probe Forms, A Through F
- Ten problems per form in a fixed order: items 1-2 ask how many times one named value appears, 3-4 ask for the mode, 5-6 ask for the range, 7-8 count how many values fall in one named ten, and 9-10 ask for the data set's own least or greatest value, the same order every form
- Every plot shows 8 to 15 invented, two-digit school data values (quiz results, books read, raffle tickets, and similar — never a real survey, never health data), with a key showing how to read one stem's row
- Every mode question is built so exactly one value has the top frequency, so the mode is never a tie
- Any value a frequency question names and any stem a count question names always appears on the plot, so the answer is never a surprise zero
- Each plot is drawn as a plain stem-and-leaf table — no image, no clip art — so the answer comes from reading the rows, not from an illustration
- No plot-and-question pairing repeats across the six forms
- Every form is a student sheet and nothing else: a big My name line, a small date line, one short instruction with a pencil picture, the ten problems numbered with room to work in every box, and one small gray tag naming the skill and the form letter. No goal text, no scoring strip, no directions: nothing on the page is written for an adult
- Rounded sans-serif type throughout, large, with white space (built to the store's student page standard)
The Answer Key And Scoring (Two Teacher Pages, 16 And 17)
- Every answer for all six forms, generated by the same code that draws the problems, in a numbered table that matches the numbers on the student sheet
- Under each form's answers, a row of boxes to mark each item and a Correct ___ / 10 box, so the scoring strip that used to sit on the form is here instead
- The giving-the-probe directions from the goal page, repeated on both pages, with the scoring rules: untimed, self-corrections count as correct, log the score the same day
The Data Log And Graph
- A y-axis already scaled 0 to 10, twelve probe columns, and the instruction to draw the aim line from the baseline to the criterion first
- A twelve-row log: date, form, correct, errors, the score used on the graph, and notes
The Caseload Summary
- Twelve student rows, baseline and criterion, eight probe columns, a trend column and a decision column
- For the data meeting: rows that are flat together are a group, a row that is flat alone is a different question
A Worked Example
- Priya, seventh grade, invented. Twelve weekly probes: the baseline taken as a median, the aim line, three points under it forcing a teaching change (pointed to each leaf while counting it out loud before writing any number down), the criterion met, and the progress-report sentence the log produces. Every number in that sentence is on the log.
A Family Update And Team Handoff Page
- A family update with blanks for this week's score and how it compares to the goal, ready to send home or read at a conference
- A team handoff checklist for a substitute, a new provider or a shift change, so whoever gives the probe that week knows exactly what to do
- A meeting summary sentence with blanks for the two numbers off the log, ready to drop into the progress report
What This Is, And What It Is Not
It is a fillable PDF. The goal page, the data log, the caseload page, the name and date lines on every student sheet, and the mark boxes and Correct box on the answer key are type-in fields: open the file in a PDF reader, click a line or a cell, type, and Save As once per student. The probe forms are meant to be printed: one copy per student per week, the student writes on the form, and that same sheet is the one you score. It works offline with no account or subscription. It does not calculate percents or draw the graph.
It is not a norm-referenced assessment and it carries no benchmark score or "typical" rate. The criteria in the sample goal are in brackets because your team sets them from the baseline and the student's IEP. Every probe is untimed on purpose; the goal page says so, so the condition stays the same all year.
Who This Is For
Sixth, seventh and eighth grade special education teachers and case managers writing data-analysis or data-display goals, intervention and Title teachers, and the paraprofessionals who give the weekly probe.
If You Want More Skills
You might also need
3-Digit Addition and Subtraction Mixed Regrouping Probes
$3.50 or with All-Access
3-Digit by 1-Digit Multiplication Progress Monitoring Probes
$3.50 or with All-Access
3-Digit by 2-Digit Multiplication Progress Monitoring Probes
$3.50 or with All-Access
3D Shape Attributes (Faces/Edges/Vertices) Probes
$3.50 or with All-Access