Supply and Demand Worksheets
- 34 pages
- 6th, 7th, 8th, 9th, 10th
$2.50 $5.00 on Teachers Pay Teachers
Half the Teachers Pay Teachers price. The same PDF, sold direct.
DownloadOr get it with All-Access: pick any 20 resources a month for $7.
New here? Your first month of All-Access is half off with code TEACHERTOK
Already bought this, or a member?
Instant download. One teacher's license: colleagues need their own copy. Each file carries a license number.
Also on Teachers Pay Teachers: see the Bright Path Sped store
About this resource
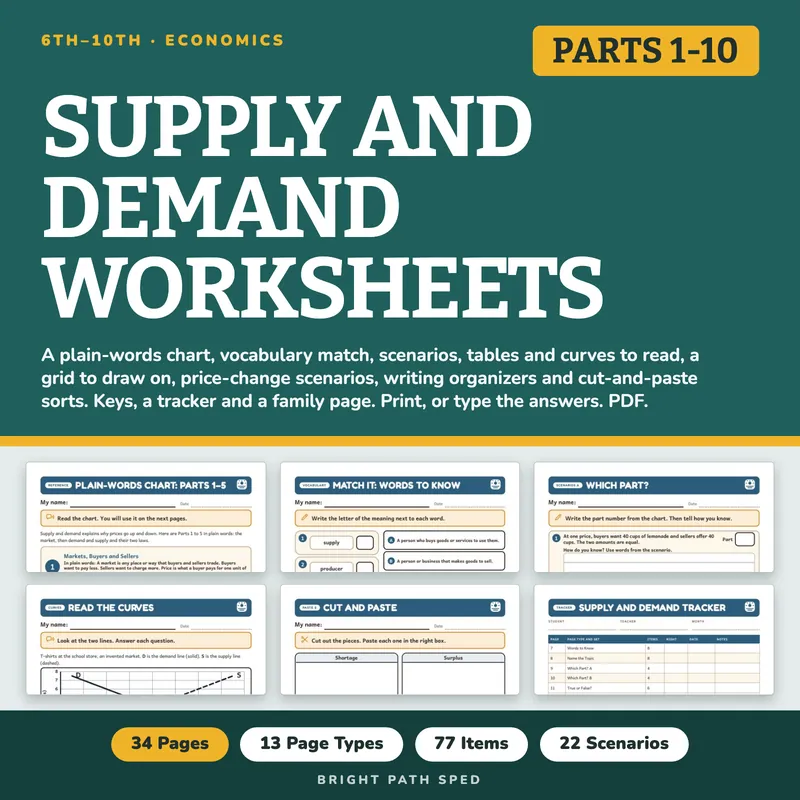
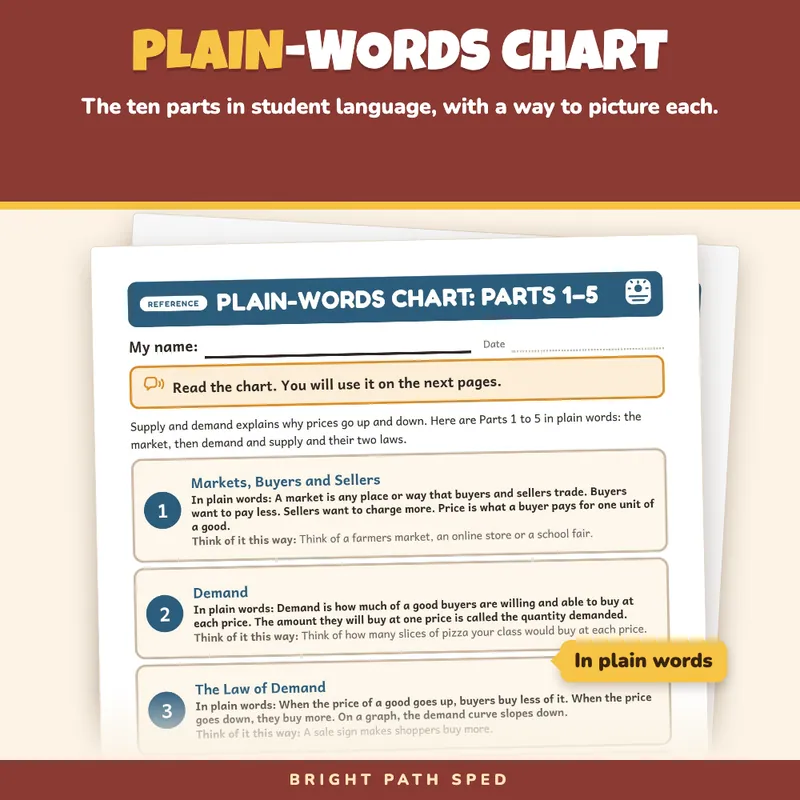
Teaching supply and demand and need something students can actually write on? This is a complete kit for one unit, written at a middle school reading level and laid out with real room to work. It starts with two plain-words charts that break the topic into ten parts: markets, demand, the law of demand, supply, the law of supply, reading a graph, equilibrium, shortage, surplus, and what happens when something changes. Students then match the vocabulary, name the topic of a short statement, tell which part fits a real-life situation and how they know, decide true or false and fix the false ones, and fill in sentences. Then they work with numbers: read a market table, read two drawn curves and find the equilibrium, circle which line moves and what the price does in six scenarios, and plot a demand curve and a supply curve on a grid. Writing pages and three cut-and-paste mats finish it. It comes with four answer keys, a tracker, a class grid, a team note and a family page, so nothing has to be written from scratch.
EVERYTHING INSIDE (34 pages)
- 17 student pages in 13 page types: Plain-Words Chart (2 pages), Match It, Name the Topic, Which Part? (2 pages), True or False?, Fill In the Sentence, Read the Market Table, Read the Curves, What Happens to the Price?, Draw the Curves, Explain It, Build a Paragraph, and Cut and Paste (3 pages)
- 77 scored items on 12 pages, every answer read from the same lists and tables that print the page, never typed by hand
- 22 invented scenarios and statements (8 to name the topic, 8 to match to a part of the chart, 6 price-change scenarios)
- 8 vocabulary words matched to 10 meanings (two meanings are not used)
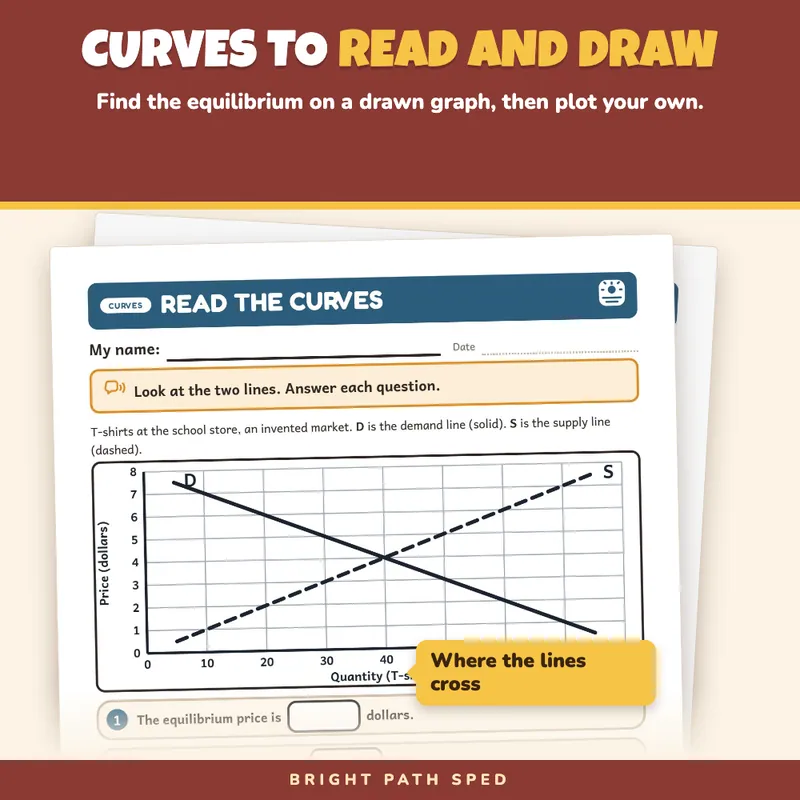
- 2 invented markets with every number computed in code: lemonade cups at a school fair (a table and a drawing grid) and T-shirts at a school store (two drawn lines to read)
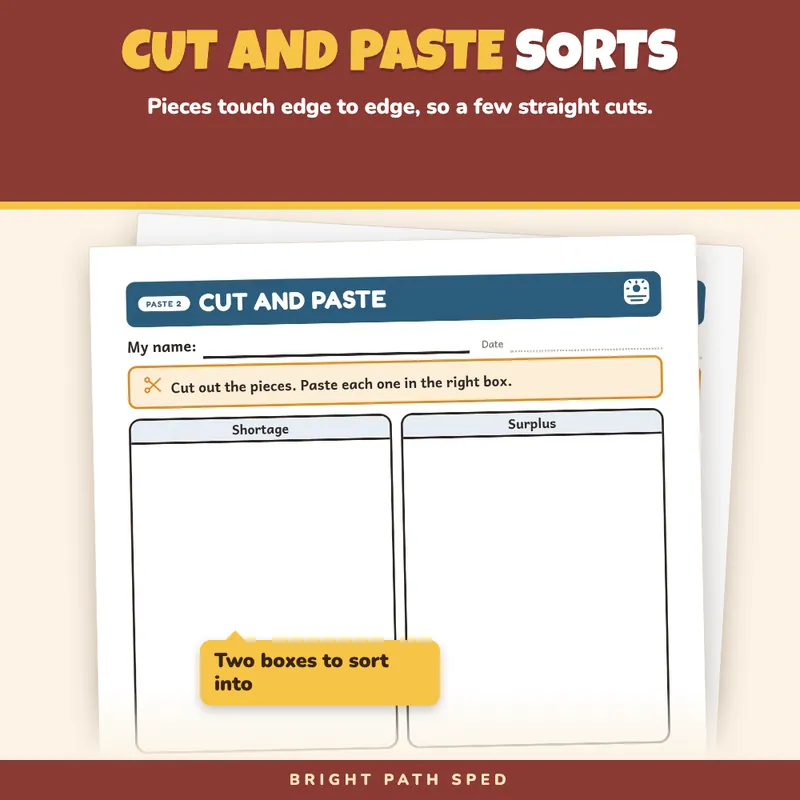
- 21 cut-and-paste pieces on 3 mats (8 pieces into demand or supply, 8 pieces into shortage or surplus, 5 steps in order back to equilibrium)
- 4 answer keys, including numbers for the table and graph pages and what to look for on the 3 open-response pages
- 1 tracker (page, page type, items right, date, notes) and 1 whole-class progress grid
- 1 team note (a hand-off page), 1 family page and 1 filled example (an invented student)
- 1 phrase bank (17 starters, including student sentence starters for explaining and claim-evidence-reasoning), 1 binder cover and 6 divider tabs with a spine label to cut out
- Start Here and a how-to-read-a-page page
The Page Types
1. Plain-Words Chart, 2 pages: Parts 1-5 and 6-10, each with a short name, what it says in plain words, and a way to picture it. Students keep it beside them for the other pages.
2. Match It: 8 words (demand, supply, equilibrium, shortage, surplus, scarcity, producer, consumer) matched to lettered meanings.
3. Name the Topic: 8 short statements; pick demand, supply, shortage or surplus from a box.
4. Which Part?, 2 pages: 8 scenarios; write the part number from the chart, then explain how you know in a 3-line ruled box.
5. True or False?: 6 statements, then fix two false ones in 4-line ruled boxes.
6. Fill In the Sentence: 8 sentences and a box of 10 words (two are not used).
7. Read the Market Table: an invented table of prices, cups buyers want and cups sellers offer. Find what buyers want and sellers offer at one price, say whether it is a shortage or a surplus and how big, and find the equilibrium. A 3-line box asks why sellers will raise the price.
8. Read the Curves: a drawn demand line and supply line for an invented T-shirt market. Read the equilibrium price and quantity, what buyers and sellers do at a low price, and the surplus at a high price.
9. What Happens to the Price?: 6 invented scenarios. Circle whether demand or supply moves, up or down, then whether the price goes up or down.
10. Draw the Curves: plot the lemonade market's buyer and seller points on a printed grid, draw the two lines, circle where they cross, and explain what the crossing point tells you.
11. Explain It and Build a Paragraph: three explain prompts with 5-line boxes and sentence starters, then a claim, evidence, reasoning organizer on what a store should do about a surplus, plus a counterpoint.
12. Cut and Paste, 3 pages: demand or supply, shortage or surplus, then five steps back to equilibrium in order. The pieces touch edge to edge, so cutting is a few straight lines, and every piece is over an inch each way.
Built For The Student Holding The Page
A "My name" line, one short instruction, large type, and no cartoons, mascots or clip art. Nothing on a student page is written for an adult. Ruled boxes are about a third of an inch a line: a short answer gets 3 lines and an explanation gets 5. Body text is 11 point or larger. The file prints clean in black and white.
No Guessing The Answer
Wherever a student picks among printed spots (the lettered meanings, the box of words, the order of the cut pieces), the position of the right answer is checked so it never sits in the same spot three times in a row.
Textbook Ideas, Invented Markets
The part summaries are the standard, textbook-level kind, kept short: the law of demand, the law of supply, equilibrium, shortage and surplus, and what moves a whole curve. Every market, price and quantity is made up for practice, no real company or product price is used, and the file has no dollar signs. Use your own curriculum or standards for anything beyond this level. There is a blank line on the tracker for your own standard or wording.
Type In, Or Print
The name line, every answer box and every ruled box are type-in fields in any PDF reader: click one, type, then save. The same goes for the tracker, the class grid, the team note and the family page. The graph grid is for pencil. This is a fillable PDF; it is not a Google Slides or PowerPoint file.
Who This Is For
Middle and early high school social studies, economics and general classes, special education and resource rooms working on the same unit, co-taught classes, and substitutes who need a unit that is ready to hand out. The reading is written at about a grades 6-8 level.
What This Is, And What It Is Not
A supply and demand worksheet set with the record-keeping around it. It is not a timed test, a screener, a clinical tool, or a claim about any student's age or rate of progress. There is no IEP goal language or eligibility wording anywhere in the file.