Data Analysis and Graphing Progress Monitoring Probes Bundle
- 2nd, 3rd, 4th, 5th, 6th, 7th, 8th
$43.50$28.28
DownloadOr get it with All-Access: pick any 20 resources a month for $7.
New here? Your first month of All-Access is half off with code TEACHERTOK
Already bought this, or a member?
Instant download. One teacher's license: colleagues need their own copy. Each file carries a license number.
Also on Teachers Pay Teachers: see the Bright Path Sped store
What's in the bundle (13)
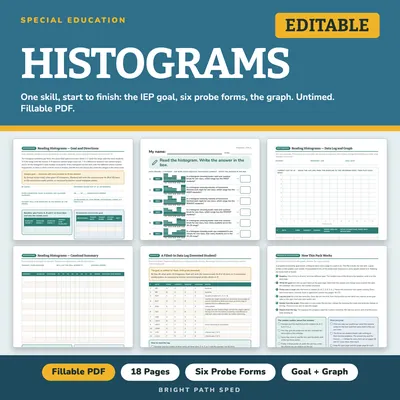 Histograms Progress Monitoring Probes$3.00
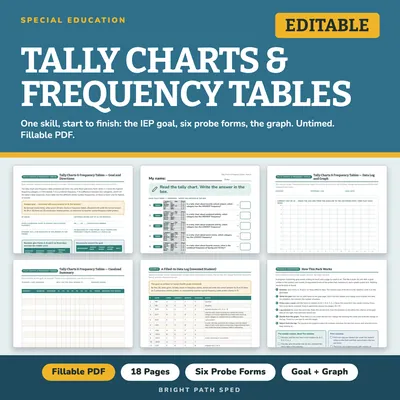 Tally Charts & Frequency Tables Progress Monitoring Probes$3.00
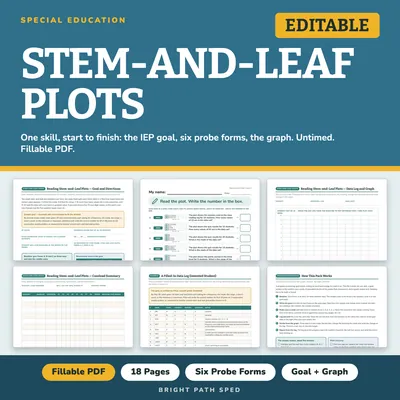 Reading Stem-and-Leaf Plots Progress Monitoring Probes$3.50
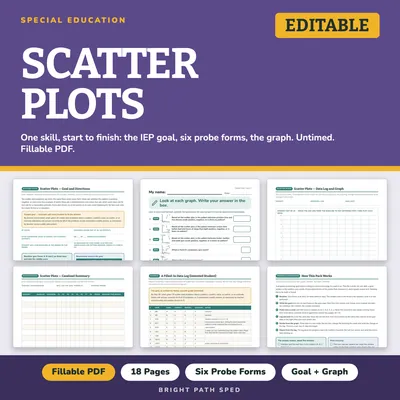 Scatter Plots Progress Monitoring Probes$3.50
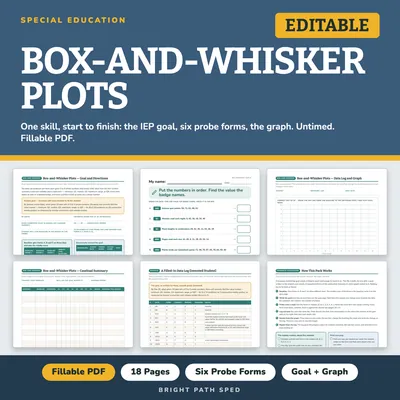 Box-and-Whisker Plots Five-Number Summary Progress Monitoring Probes$3.50
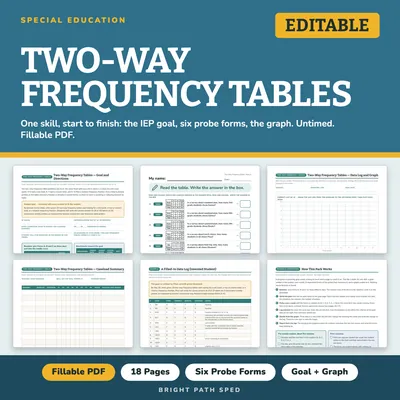 Two-Way Frequency Tables Progress Monitoring Probes$3.50
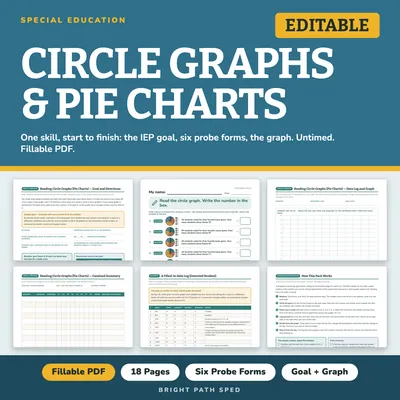 Reading Circle Graphs and Pie Charts Progress Monitoring Probes$3.00
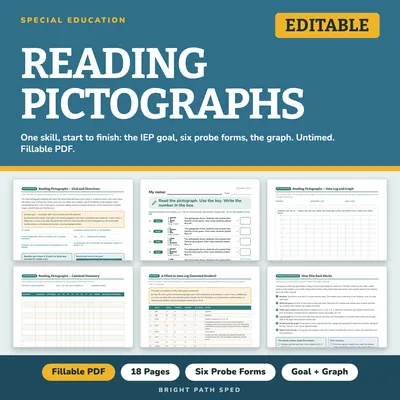 Reading and Interpreting Pictographs Progress Monitoring Probes$3.50
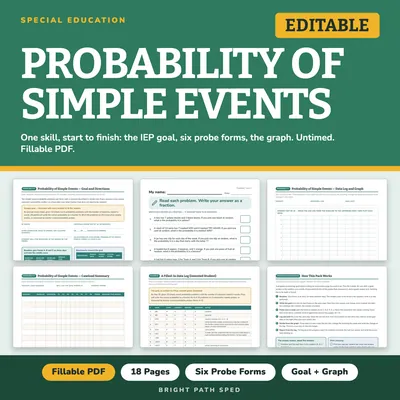 Probability of Simple Events Progress Monitoring Probes$3.50
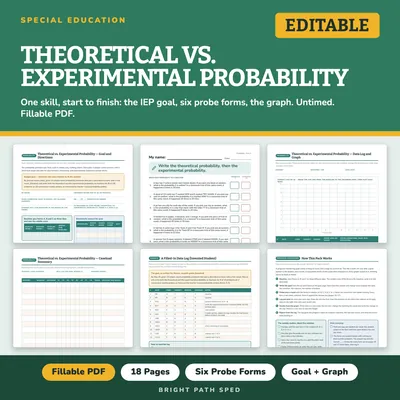 Theoretical vs. Experimental Probability Progress Monitoring Probes$3.50
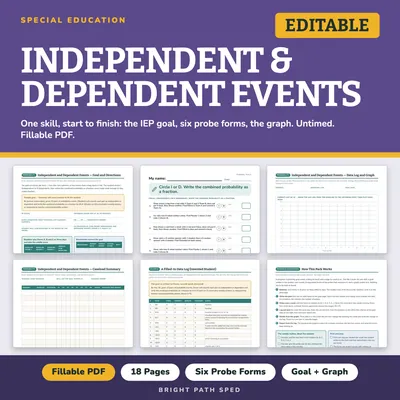 Independent and Dependent Events Progress Monitoring Probes$3.50
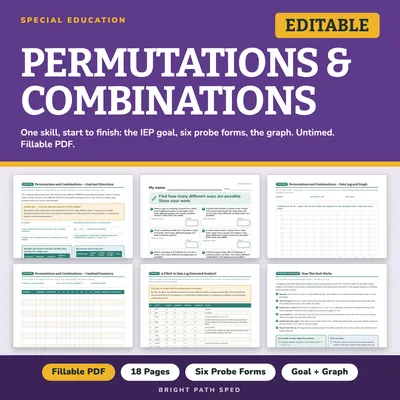 Permutations and Combinations Progress Monitoring Probes$3.50
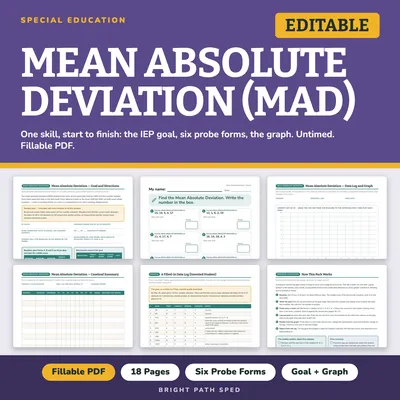 Mean Absolute Deviation (MAD) Progress Monitoring Probes$3.00
About this resource
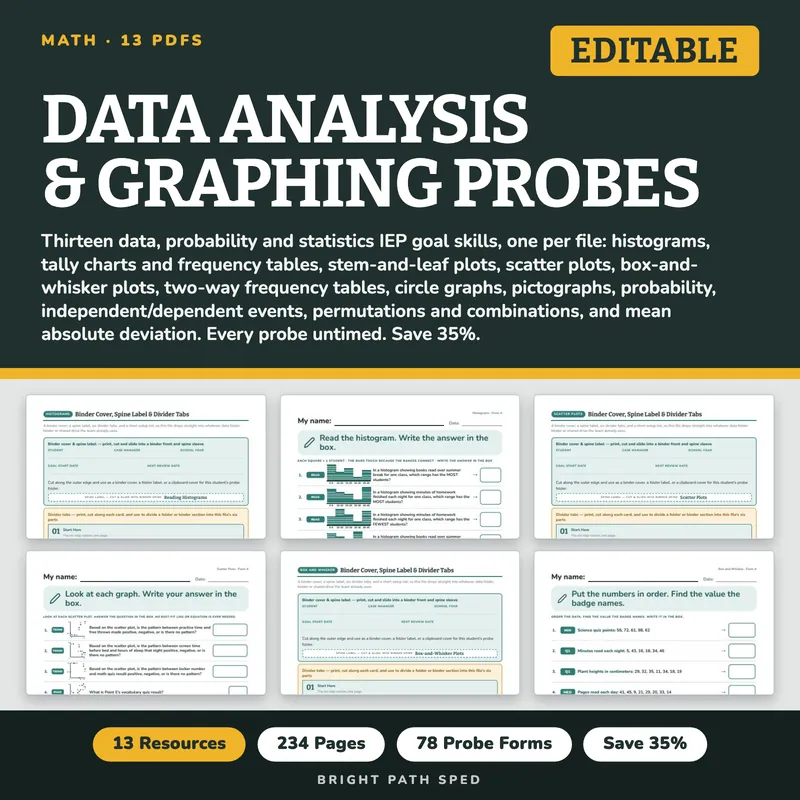
Thirteen data-display, probability and statistics IEP goals, upper elementary through middle school — one skill per file, each with six probe forms and a graph or worked example scaled to the probe.
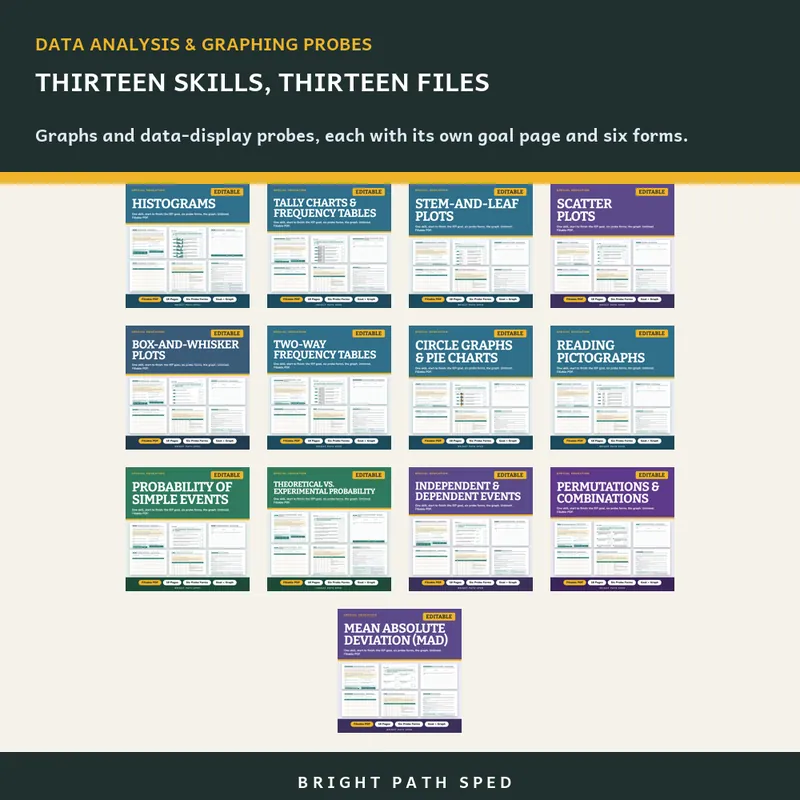
Thirteen skills, one per file: histograms, tally charts and frequency tables, stem-and-leaf plots, scatter plots, box-and-whisker plots (five-number summary), two-way frequency tables, circle graphs (pie charts), pictographs, probability of simple events, theoretical vs. experimental probability, independent and dependent events, permutations and combinations, and mean absolute deviation (MAD). None of these thirteen singles is a member of any other live bundle, so nothing here is sold twice.
WHAT IS IN THE BUNDLE - 13 fillable PDFs, 234 pages, 78 probe forms
- Histograms Progress Monitoring Probes - 18 pages, 6 forms, $3.00
- Tally Charts & Frequency Tables Progress Monitoring Probes - 18 pages, 6 forms, $3.00
- Reading Stem-and-Leaf Plots Progress Monitoring Probes - 18 pages, 6 forms, $3.50
- Scatter Plots Progress Monitoring Probes - 18 pages, 6 forms, $3.50
- Box-and-Whisker Plots Five-Number Summary Progress Monitoring Probes - 18 pages, 6 forms, $3.50
- Two-Way Frequency Tables Progress Monitoring Probes - 18 pages, 6 forms, $3.50
- Reading Circle Graphs and Pie Charts Progress Monitoring Probes - 18 pages, 6 forms, $3.00
- Reading and Interpreting Pictographs Progress Monitoring Probes - 18 pages, 6 forms, $3.50
- Probability of Simple Events Progress Monitoring Probes - 18 pages, 6 forms, $3.50
- Theoretical vs. Experimental Probability Progress Monitoring Probes - 18 pages, 6 forms, $3.50
- Independent and Dependent Events Progress Monitoring Probes - 18 pages, 6 forms, $3.50
- Permutations and Combinations Progress Monitoring Probes - 18 pages, 6 forms, $3.50
- Mean Absolute Deviation (MAD) Progress Monitoring Probes - 18 pages, 6 forms, $3.00
What Every File Contains
- A goal page: what the probe measures, a sample goal (invented, every bracket edited by your team), the goal frame as type-in fields, a baseline table for three probes and the median, benchmark rows, and administration and scoring directions
- A binder organizer: a print-and-slide binder cover and divider tabs, so the file drops straight into whatever data folder, binder or shared drive the team already uses
- The probe forms: items drawn the same way across six forms (A-F), so a change in the score is the student and not the form
- A teacher answer key: every answer for all six forms, generated by the same code that draws the problems, and a Correct ___ / 10 box per form
- A data log and graph: rows for repeated probes, a y-axis already scaled to the probe, the aim line drawn first
What This Is, And What It Is Not
Fillable PDFs. Goal pages, the goal box on every probe form, and data logs are type-in fields: click, type, Save As once per student. The probe forms are meant to be printed: one copy per student per week, the student writes on the form, and that same sheet is the one you score. Works offline with no account or subscription; nothing calculates percents or draws the graph for you.
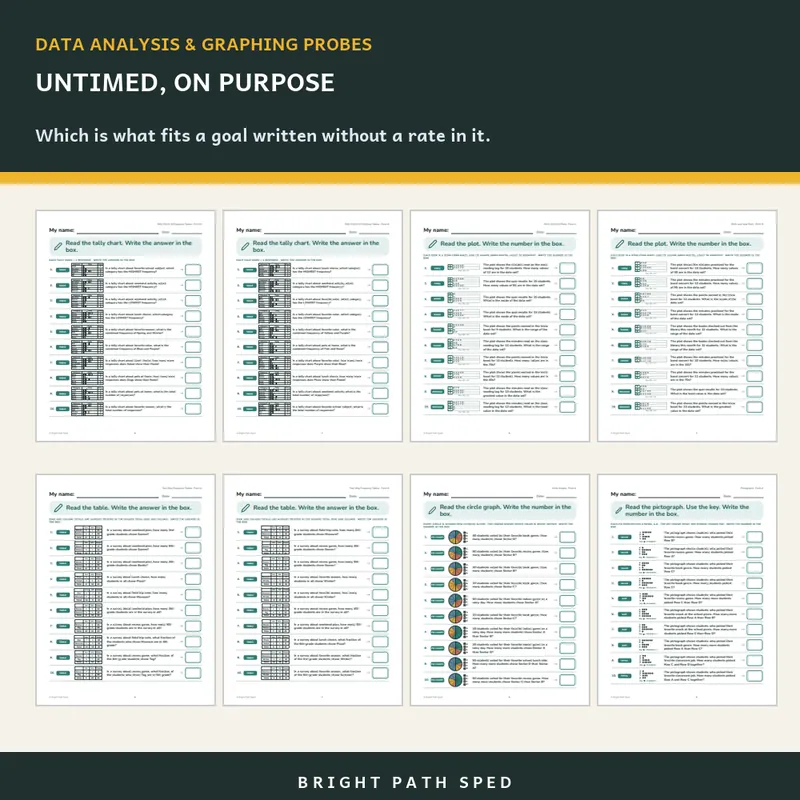
Not a norm-referenced assessment. No benchmark scores, no "typical" rates; the criteria in the sample goals are in brackets because your team sets them from the baseline and the student's IEP. Every probe is untimed on purpose and the goal pages say so, so the condition stays the same all year.
Who This Is For
Upper elementary and middle school special education teachers and case managers writing math data-analysis goals, intervention teachers, and the paraprofessionals who give the weekly probe.