Visual Processing and Perception Skills Progress Monitoring
- 23 pages
- Not Grade Specific
$3.50
DownloadOr get it with All-Access: pick any 20 resources a month for $7.
New here? Your first month of All-Access is half off with code TEACHERTOK
Already bought this, or a member?
Instant download. One teacher's license: colleagues need their own copy. Each file carries a license number.
Also on Teachers Pay Teachers: see the Bright Path Sped store
About this resource
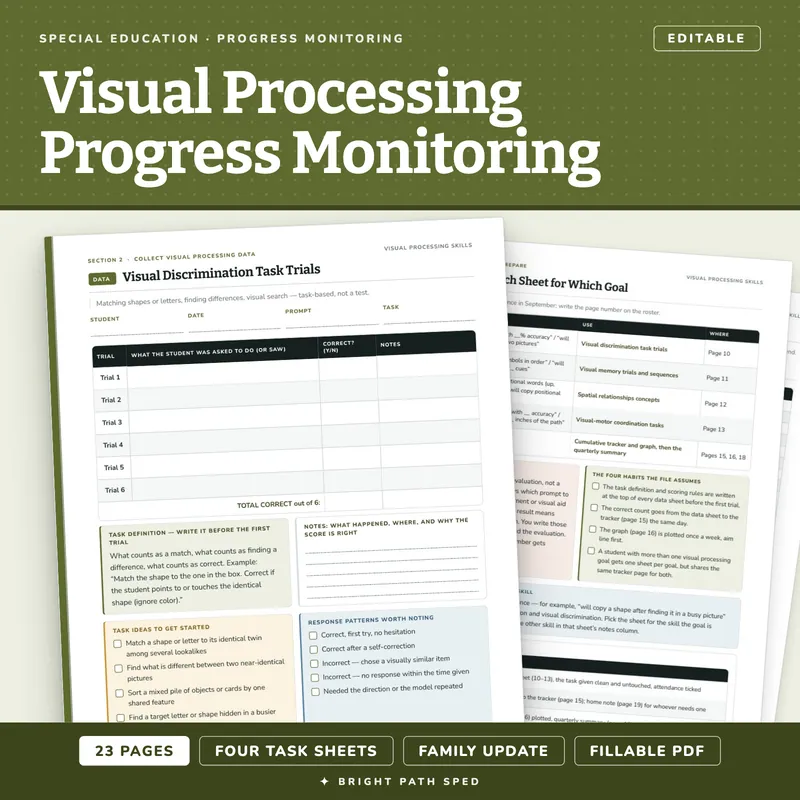
Visual discrimination, memory, spatial relationships, and visual-motor coordination — task-based data sheets for tracking IEP goals in visual processing. A fillable PDF with a print-and-cut binder cover and divider tabs, a chooser, four data sheets for different visual processing skills, a tracker and graph, a quarterly summary, a family note, a phrase bank, and a filled-in example from an invented student.
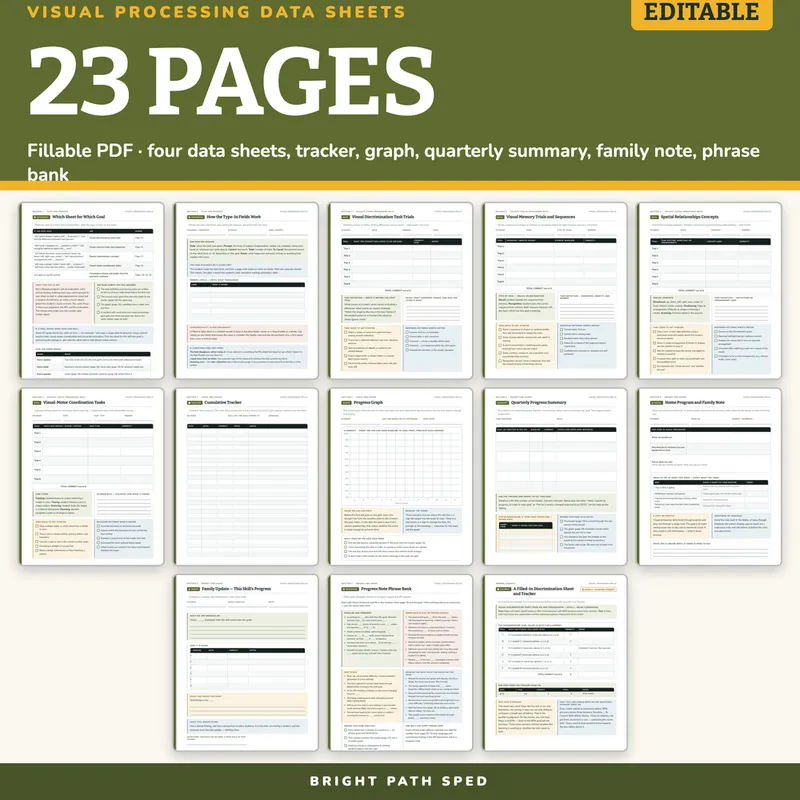
EVERYTHING INSIDE - 23 pages, 377 type-in fields
Setup
- Start Here: Three Steps - goal setup, weekly routine, decision rules
- Binder Cover and Divider Tabs - a print-and-cut binder cover for the student or caseload, four divider tabs (one per section), and a before-the-first-session checklist
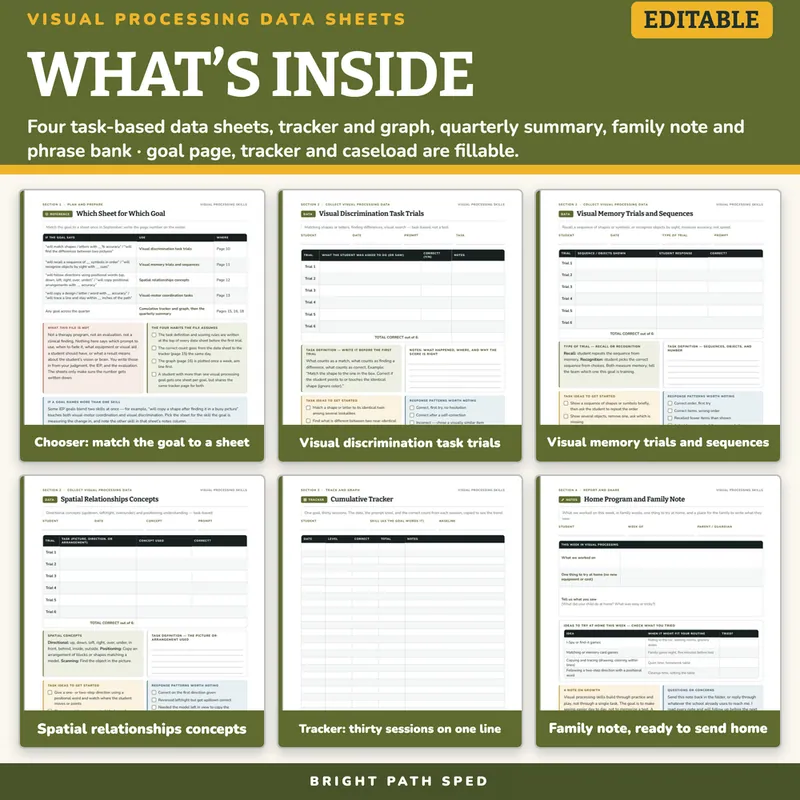
- Which Sheet for Which Goal - a chooser that matches goal wording to the right sheet, and a table of how the paper moves each day and week
- How the Type-In Fields Work - one page explaining fields, tasks, and what stays the same
Four Task-Based Data Sheets
- Visual Discrimination: Matching shapes or letters, finding differences, visual search — six trials per session, count correct
- Visual Memory: Recall a sequence of shapes or symbols, or recognize objects by sight — six trials, measure accuracy not speed
- Spatial Relationships: Directional concepts (up/down, left/right, over/under) and positioning understanding — six trials per session
- Visual-Motor Coordination: Copying, tracing, scanning, and visual-motor planning — six trials, observable tasks with observable scoring
Tracking And Reporting
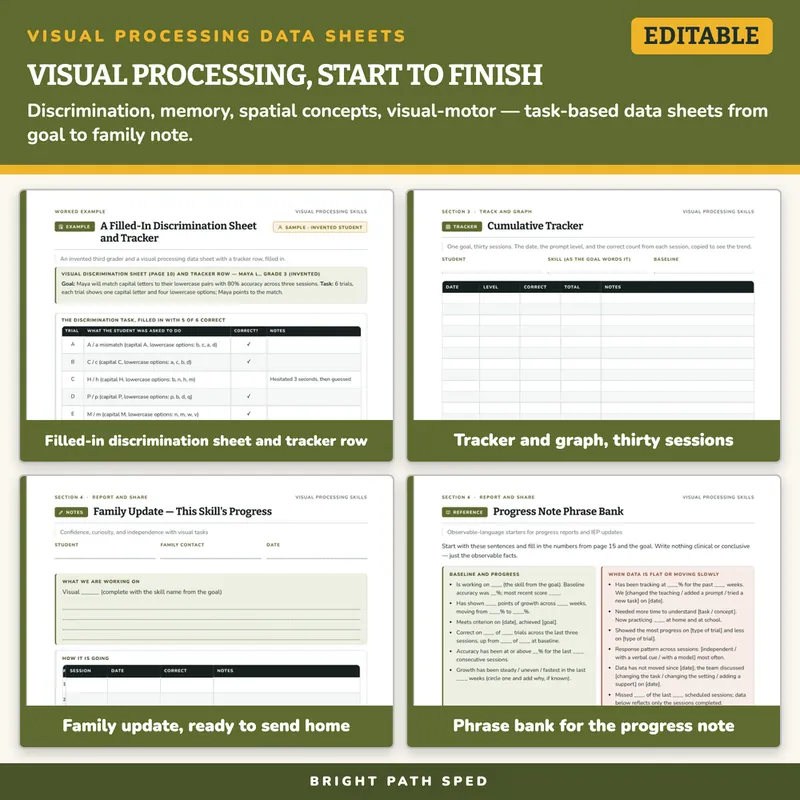
- Cumulative Tracker - thirty sessions: date, prompt level, correct count, percent or rubric level, notes (copy from a data sheet same day)
- Progress Graph - twelve weeks, aim line drawn first (baseline to criterion), then plot each session
- Quarterly Progress Summary - one page: baseline, current level, status, one sentence per goal
- Family Note - what we worked on, one thing to try at home, a place for the family to reply
- Progress Note Phrase Bank - observable-language starters for progress reports, from baseline and growth through next steps, no clinical language
- A filled-in example: discrimination sheet and tracker row from an invented third grader with every number checked against the table
What This Is, And What It Is Not
It is a fillable PDF. Open it in Acrobat Reader, type the goal, the task definition, the date, and the correct count, and Save As once per student. It works offline with no account or subscription. It is NOT a Google Sheets, Doc, or PowerPoint file.
It is not an eye exam, a vision screening, or a standardized test. The sheets measure what the student could do on the task that day, not what the student's eyes or visual system "are." No benchmark or norm is printed inside; your team sets the criterion from the IEP and the baseline. No diagnosis or clinical finding belongs in the sheets — the only numbers are the correct count, the prompt level, and the task description.
Who This Is For
Vision teachers, OT and PT specialists, and special education teachers with IEP goals in visual processing (not vision acuity). Paraprofessionals who take the data, related-services coordinators who need the same sheet used the same way in every setting, and case managers who report the quarterly progress.